from matplotlib import pyplot as plt
import numpy as np
import pandas as pd
import seaborn as snsKembali ke EDA
MATPLOTLIB
1. Line Plot
2. Scatter Plot
3. Bar Chart
4. Pie Chart
5. Sub Plot
#Fungsi Mendasar Matplotlib
#axes.plot(x,y,label='Sesuatu')

x=[0,1,2,3,4,5,6]
y=[10,20,30,40,50,60,70]
fig,axes= plt.subplots(nrows=1,ncols=1,figsize=(12,8))
axes.plot(x,y,label='Percobaan')
dates=['2000-01-01','2000-01-02','2000-01-03','2000-01-04','2000-01-05',
       '2000-01-06','2000-01-07','2000-01-08','2000-01-09','2000-01-10']

min_temperature=[20.7,17.9,18.8,14.6,17.4,21.8,20.0,15.8,15.8,15.8]
max_temperature=[34.7,28.9,31.8,28.4,30.8,32.0,25.6,28.8,21.8,22.8]

fig,axes = plt.subplots(nrows=1,ncols=1,figsize=(12,8))

axes.plot(dates,min_temperature,label='Min Temperature')
axes.plot(dates,max_temperature,label='Max Temperature')
axes.legend()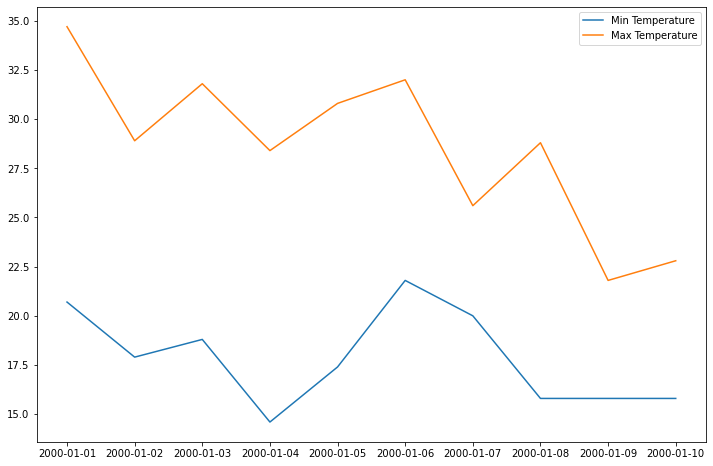
Axes.set_xlabel() Mengganti label untuk sumbu x
Axes.set_ylabel() Mengganti label untuk sumbu y
Axes.set_xlim() Membatasi sumbu xnya
Axes.set_ylim() Membatasi sumbu ynya
fig,axes=plt.subplots(nrows=1,ncols=1,figsize=(12,8))

axes.plot(dates,min_temperature,label='Min Temperature')
axes.plot(dates,max_temperature,label='Max Temperature')

axes.set_xlabel('Date',fontsize=12)
axes.set_ylabel('Temperature',fontsize=12)

axes.set_title("Minimum and Maximum Temperature",fontsize=12)

axes.set_xticks(dates)
axes.set_xticklabels(dates)
axes.tick_params('x',labelsize=12,labelrotation=45,size=12)

axes.set_ylim(10,40)
axes.set_yticks(np.arange(10,41,2))

axes.legend(fontsize=12,loc='upper left')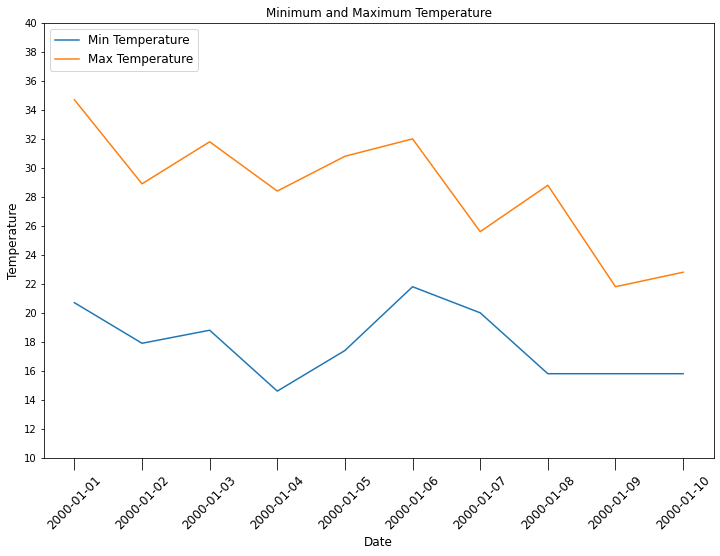
x=[1,2,3,4] #<----- definisikan titik-titik yang ingin dipetakan
y=[1,2,3,4] #<----- definisikan titik-titik yang ingin dipetakan

fig,axes=plt.subplots(nrows=1,ncols=1,figsize=(12,8))

axes.plot(x,y,label='nama')
DATAFRAMES
Silakan download: Canada.xlsx
hai='Canada.xlsx'
df=pd.read_excel(hai,sheet_name='Canada by Citizenship',skiprows=range(20),skipfooter=2)

df.head() #Kurang spesifik ngambil yang mana| Type | Coverage | OdName | AREA | AreaName | REG | RegName | DEV | DevName | 1980 | ... | 2004 | 2005 | 2006 | 2007 | 2008 | 2009 | 2010 | 2011 | 2012 | 2013 | |
|---|---|---|---|---|---|---|---|---|---|---|---|---|---|---|---|---|---|---|---|---|---|
| 0 | Immigrants | Foreigners | Afghanistan | 935 | Asia | 5501 | Southern Asia | 902 | Developing regions | 16 | ... | 2978 | 3436 | 3009 | 2652 | 2111 | 1746 | 1758 | 2203 | 2635 | 2004 |
| 1 | Immigrants | Foreigners | Albania | 908 | Europe | 925 | Southern Europe | 901 | Developed regions | 1 | ... | 1450 | 1223 | 856 | 702 | 560 | 716 | 561 | 539 | 620 | 603 |
| 2 | Immigrants | Foreigners | Algeria | 903 | Africa | 912 | Northern Africa | 902 | Developing regions | 80 | ... | 3616 | 3626 | 4807 | 3623 | 4005 | 5393 | 4752 | 4325 | 3774 | 4331 |
| 3 | Immigrants | Foreigners | American Samoa | 909 | Oceania | 957 | Polynesia | 902 | Developing regions | 0 | ... | 0 | 0 | 1 | 0 | 0 | 0 | 0 | 0 | 0 | 0 |
| 4 | Immigrants | Foreigners | Andorra | 908 | Europe | 925 | Southern Europe | 901 | Developed regions | 0 | ... | 0 | 0 | 1 | 1 | 0 | 0 | 0 | 0 | 1 | 1 |
5 rows × 43 columns
#Menghapus yang ga mau dipake
df.drop(['AREA','REG','DEV','Type','Coverage'],axis=1,inplace=True)

df.head()| OdName | AreaName | RegName | DevName | 1980 | 1981 | 1982 | 1983 | 1984 | 1985 | ... | 2004 | 2005 | 2006 | 2007 | 2008 | 2009 | 2010 | 2011 | 2012 | 2013 | |
|---|---|---|---|---|---|---|---|---|---|---|---|---|---|---|---|---|---|---|---|---|---|
| 0 | Afghanistan | Asia | Southern Asia | Developing regions | 16 | 39 | 39 | 47 | 71 | 340 | ... | 2978 | 3436 | 3009 | 2652 | 2111 | 1746 | 1758 | 2203 | 2635 | 2004 |
| 1 | Albania | Europe | Southern Europe | Developed regions | 1 | 0 | 0 | 0 | 0 | 0 | ... | 1450 | 1223 | 856 | 702 | 560 | 716 | 561 | 539 | 620 | 603 |
| 2 | Algeria | Africa | Northern Africa | Developing regions | 80 | 67 | 71 | 69 | 63 | 44 | ... | 3616 | 3626 | 4807 | 3623 | 4005 | 5393 | 4752 | 4325 | 3774 | 4331 |
| 3 | American Samoa | Oceania | Polynesia | Developing regions | 0 | 1 | 0 | 0 | 0 | 0 | ... | 0 | 0 | 1 | 0 | 0 | 0 | 0 | 0 | 0 | 0 |
| 4 | Andorra | Europe | Southern Europe | Developed regions | 0 | 0 | 0 | 0 | 0 | 0 | ... | 0 | 0 | 1 | 1 | 0 | 0 | 0 | 0 | 1 | 1 |
5 rows × 38 columns
df.rename(columns={'OdName':'Country','AreaName':'Continent','RegName':'Region'},inplace=True)
df.head()| Country | Continent | Region | DevName | 1980 | 1981 | 1982 | 1983 | 1984 | 1985 | ... | 2004 | 2005 | 2006 | 2007 | 2008 | 2009 | 2010 | 2011 | 2012 | 2013 | |
|---|---|---|---|---|---|---|---|---|---|---|---|---|---|---|---|---|---|---|---|---|---|
| 0 | Afghanistan | Asia | Southern Asia | Developing regions | 16 | 39 | 39 | 47 | 71 | 340 | ... | 2978 | 3436 | 3009 | 2652 | 2111 | 1746 | 1758 | 2203 | 2635 | 2004 |
| 1 | Albania | Europe | Southern Europe | Developed regions | 1 | 0 | 0 | 0 | 0 | 0 | ... | 1450 | 1223 | 856 | 702 | 560 | 716 | 561 | 539 | 620 | 603 |
| 2 | Algeria | Africa | Northern Africa | Developing regions | 80 | 67 | 71 | 69 | 63 | 44 | ... | 3616 | 3626 | 4807 | 3623 | 4005 | 5393 | 4752 | 4325 | 3774 | 4331 |
| 3 | American Samoa | Oceania | Polynesia | Developing regions | 0 | 1 | 0 | 0 | 0 | 0 | ... | 0 | 0 | 1 | 0 | 0 | 0 | 0 | 0 | 0 | 0 |
| 4 | Andorra | Europe | Southern Europe | Developed regions | 0 | 0 | 0 | 0 | 0 | 0 | ... | 0 | 0 | 1 | 1 | 0 | 0 | 0 | 0 | 1 | 1 |
5 rows × 38 columns
df.columns=list(map(str,df.columns)) #Mengubah semua nama kolom menjadi string
df.head()| Country | Continent | Region | DevName | 1980 | 1981 | 1982 | 1983 | 1984 | 1985 | ... | 2004 | 2005 | 2006 | 2007 | 2008 | 2009 | 2010 | 2011 | 2012 | 2013 | |
|---|---|---|---|---|---|---|---|---|---|---|---|---|---|---|---|---|---|---|---|---|---|
| 0 | Afghanistan | Asia | Southern Asia | Developing regions | 16 | 39 | 39 | 47 | 71 | 340 | ... | 2978 | 3436 | 3009 | 2652 | 2111 | 1746 | 1758 | 2203 | 2635 | 2004 |
| 1 | Albania | Europe | Southern Europe | Developed regions | 1 | 0 | 0 | 0 | 0 | 0 | ... | 1450 | 1223 | 856 | 702 | 560 | 716 | 561 | 539 | 620 | 603 |
| 2 | Algeria | Africa | Northern Africa | Developing regions | 80 | 67 | 71 | 69 | 63 | 44 | ... | 3616 | 3626 | 4807 | 3623 | 4005 | 5393 | 4752 | 4325 | 3774 | 4331 |
| 3 | American Samoa | Oceania | Polynesia | Developing regions | 0 | 1 | 0 | 0 | 0 | 0 | ... | 0 | 0 | 1 | 0 | 0 | 0 | 0 | 0 | 0 | 0 |
| 4 | Andorra | Europe | Southern Europe | Developed regions | 0 | 0 | 0 | 0 | 0 | 0 | ... | 0 | 0 | 1 | 1 | 0 | 0 | 0 | 0 | 1 | 1 |
5 rows × 38 columns
df.set_index('Country',inplace=True) #Mengubah Country menajadi indexdf.head()| Continent | Region | DevName | 1980 | 1981 | 1982 | 1983 | 1984 | 1985 | 1986 | ... | 2004 | 2005 | 2006 | 2007 | 2008 | 2009 | 2010 | 2011 | 2012 | 2013 | |
|---|---|---|---|---|---|---|---|---|---|---|---|---|---|---|---|---|---|---|---|---|---|
| Country | |||||||||||||||||||||
| Afghanistan | Asia | Southern Asia | Developing regions | 16 | 39 | 39 | 47 | 71 | 340 | 496 | ... | 2978 | 3436 | 3009 | 2652 | 2111 | 1746 | 1758 | 2203 | 2635 | 2004 |
| Albania | Europe | Southern Europe | Developed regions | 1 | 0 | 0 | 0 | 0 | 0 | 1 | ... | 1450 | 1223 | 856 | 702 | 560 | 716 | 561 | 539 | 620 | 603 |
| Algeria | Africa | Northern Africa | Developing regions | 80 | 67 | 71 | 69 | 63 | 44 | 69 | ... | 3616 | 3626 | 4807 | 3623 | 4005 | 5393 | 4752 | 4325 | 3774 | 4331 |
| American Samoa | Oceania | Polynesia | Developing regions | 0 | 1 | 0 | 0 | 0 | 0 | 0 | ... | 0 | 0 | 1 | 0 | 0 | 0 | 0 | 0 | 0 | 0 |
| Andorra | Europe | Southern Europe | Developed regions | 0 | 0 | 0 | 0 | 0 | 0 | 2 | ... | 0 | 0 | 1 | 1 | 0 | 0 | 0 | 0 | 1 | 1 |
5 rows × 37 columns
df['Total']=df.sum(axis=1)
df.head()| Continent | Region | DevName | 1980 | 1981 | 1982 | 1983 | 1984 | 1985 | 1986 | ... | 2005 | 2006 | 2007 | 2008 | 2009 | 2010 | 2011 | 2012 | 2013 | Total | |
|---|---|---|---|---|---|---|---|---|---|---|---|---|---|---|---|---|---|---|---|---|---|
| Country | |||||||||||||||||||||
| Afghanistan | Asia | Southern Asia | Developing regions | 16 | 39 | 39 | 47 | 71 | 340 | 496 | ... | 3436 | 3009 | 2652 | 2111 | 1746 | 1758 | 2203 | 2635 | 2004 | 58639 |
| Albania | Europe | Southern Europe | Developed regions | 1 | 0 | 0 | 0 | 0 | 0 | 1 | ... | 1223 | 856 | 702 | 560 | 716 | 561 | 539 | 620 | 603 | 15699 |
| Algeria | Africa | Northern Africa | Developing regions | 80 | 67 | 71 | 69 | 63 | 44 | 69 | ... | 3626 | 4807 | 3623 | 4005 | 5393 | 4752 | 4325 | 3774 | 4331 | 69439 |
| American Samoa | Oceania | Polynesia | Developing regions | 0 | 1 | 0 | 0 | 0 | 0 | 0 | ... | 0 | 1 | 0 | 0 | 0 | 0 | 0 | 0 | 0 | 6 |
| Andorra | Europe | Southern Europe | Developed regions | 0 | 0 | 0 | 0 | 0 | 0 | 2 | ... | 0 | 1 | 1 | 0 | 0 | 0 | 0 | 1 | 1 | 15 |
5 rows × 38 columns
years=list(map(str,range(1980,2014))) #buatlah sebuah list berupa pemetaan string dimana rangenya itu dari 1980 sampai 2014
years
['1980',
'1981',
'1982',
'1983',
'1984',
'1985',
'1986',
'1987',
'1988',
'1989',
'1990',
'1991',
'1992',
'1993',
'1994',
'1995',
'1996',
'1997',
'1998',
'1999',
'2000',
'2001',
'2002',
'2003',
'2004',
'2005',
'2006',
'2007',
'2008',
'2009',
'2010',
'2011',
'2012',
'2013']LINE CHART
algeria = df.loc['Algeria',years]
algeria
1980 80
1981 67
1982 71
1983 69
1984 63
1985 44
1986 69
1987 132
1988 242
1989 434
1990 491
1991 872
1992 795
1993 717
1994 595
1995 1106
1996 2054
1997 1842
1998 2292
1999 2389
2000 2867
2001 3418
2002 3406
2003 3072
2004 3616
2005 3626
2006 4807
2007 3623
2008 4005
2009 5393
2010 4752
2011 4325
2012 3774
2013 4331
Name: Algeria, dtype: objectalgeria.index=algeria.index.map(int) #Mengubah tahun menjadi integer
algeria1980 80
1981 67
1982 71
1983 69
1984 63
1985 44
1986 69
1987 132
1988 242
1989 434
1990 491
1991 872
1992 795
1993 717
1994 595
1995 1106
1996 2054
1997 1842
1998 2292
1999 2389
2000 2867
2001 3418
2002 3406
2003 3072
2004 3616
2005 3626
2006 4807
2007 3623
2008 4005
2009 5393
2010 4752
2011 4325
2012 3774
2013 4331
Name: Algeria, dtype: objectalgeria.plot(kind='line',figsize=(10,6))
plt.title('Citizenship Algeria')
plt.ylabel('Banyak Warga')
plt.xlabel('Tahun')Text(0.5, 0, 'Tahun')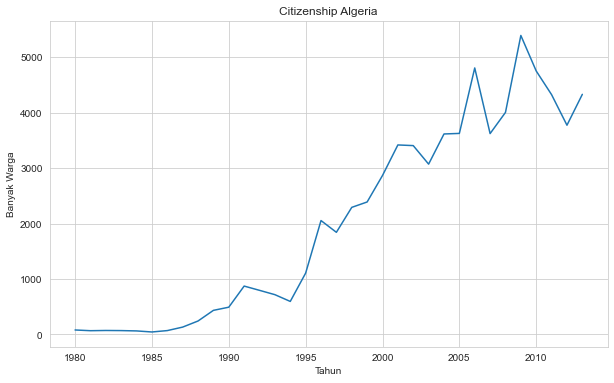
albania=df.loc['Albania',years]
albania.index=albania.index.map(int)
albania.plot(kind='line',figsize=(10,6))
algeria.plot(kind='line',figsize=(10,6))

plt.title('Citizenship Algeria')

plt.ylabel('Banyak Warga')
plt.xlabel('Tahun')
Text(0.5, 0, 'Tahun')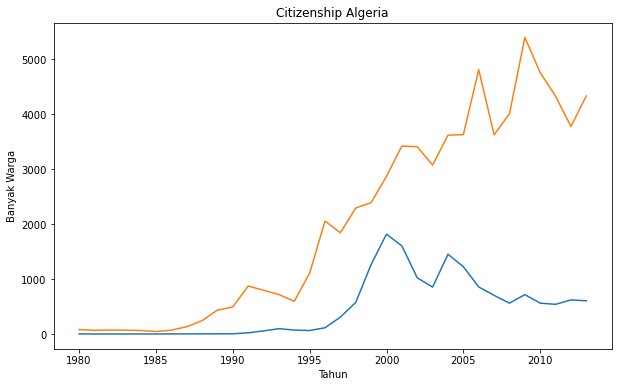
SCATTER PLOT
df_total=pd.DataFrame(df[years].sum(axis=0))
df_total| 0 | |
|---|---|
| 1980 | 99137 |
| 1981 | 110563 |
| 1982 | 104271 |
| 1983 | 75550 |
| 1984 | 73417 |
| 1985 | 69978 |
| 1986 | 86048 |
| 1987 | 134771 |
| 1988 | 139306 |
| 1989 | 164432 |
| 1990 | 188054 |
| 1991 | 207509 |
| 1992 | 221687 |
| 1993 | 222049 |
| 1994 | 193665 |
| 1995 | 187712 |
| 1996 | 200085 |
| 1997 | 192885 |
| 1998 | 160727 |
| 1999 | 179818 |
| 2000 | 216712 |
| 2001 | 242643 |
| 2002 | 223111 |
| 2003 | 217297 |
| 2004 | 232083 |
| 2005 | 257457 |
| 2006 | 247057 |
| 2007 | 232405 |
| 2008 | 243047 |
| 2009 | 248768 |
| 2010 | 276956 |
| 2011 | 246194 |
| 2012 | 256222 |
| 2013 | 257537 |
df_total.reset_index(inplace=True)
df_total| index | 0 | |
|---|---|---|
| 0 | 1980 | 99137 |
| 1 | 1981 | 110563 |
| 2 | 1982 | 104271 |
| 3 | 1983 | 75550 |
| 4 | 1984 | 73417 |
| 5 | 1985 | 69978 |
| 6 | 1986 | 86048 |
| 7 | 1987 | 134771 |
| 8 | 1988 | 139306 |
| 9 | 1989 | 164432 |
| 10 | 1990 | 188054 |
| 11 | 1991 | 207509 |
| 12 | 1992 | 221687 |
| 13 | 1993 | 222049 |
| 14 | 1994 | 193665 |
| 15 | 1995 | 187712 |
| 16 | 1996 | 200085 |
| 17 | 1997 | 192885 |
| 18 | 1998 | 160727 |
| 19 | 1999 | 179818 |
| 20 | 2000 | 216712 |
| 21 | 2001 | 242643 |
| 22 | 2002 | 223111 |
| 23 | 2003 | 217297 |
| 24 | 2004 | 232083 |
| 25 | 2005 | 257457 |
| 26 | 2006 | 247057 |
| 27 | 2007 | 232405 |
| 28 | 2008 | 243047 |
| 29 | 2009 | 248768 |
| 30 | 2010 | 276956 |
| 31 | 2011 | 246194 |
| 32 | 2012 | 256222 |
| 33 | 2013 | 257537 |
df_total.columns=['year','total']
df_total| year | total | |
|---|---|---|
| 0 | 1980 | 99137 |
| 1 | 1981 | 110563 |
| 2 | 1982 | 104271 |
| 3 | 1983 | 75550 |
| 4 | 1984 | 73417 |
| 5 | 1985 | 69978 |
| 6 | 1986 | 86048 |
| 7 | 1987 | 134771 |
| 8 | 1988 | 139306 |
| 9 | 1989 | 164432 |
| 10 | 1990 | 188054 |
| 11 | 1991 | 207509 |
| 12 | 1992 | 221687 |
| 13 | 1993 | 222049 |
| 14 | 1994 | 193665 |
| 15 | 1995 | 187712 |
| 16 | 1996 | 200085 |
| 17 | 1997 | 192885 |
| 18 | 1998 | 160727 |
| 19 | 1999 | 179818 |
| 20 | 2000 | 216712 |
| 21 | 2001 | 242643 |
| 22 | 2002 | 223111 |
| 23 | 2003 | 217297 |
| 24 | 2004 | 232083 |
| 25 | 2005 | 257457 |
| 26 | 2006 | 247057 |
| 27 | 2007 | 232405 |
| 28 | 2008 | 243047 |
| 29 | 2009 | 248768 |
| 30 | 2010 | 276956 |
| 31 | 2011 | 246194 |
| 32 | 2012 | 256222 |
| 33 | 2013 | 257537 |
df_total.plot('year','total',kind='scatter',figsize=(10,6))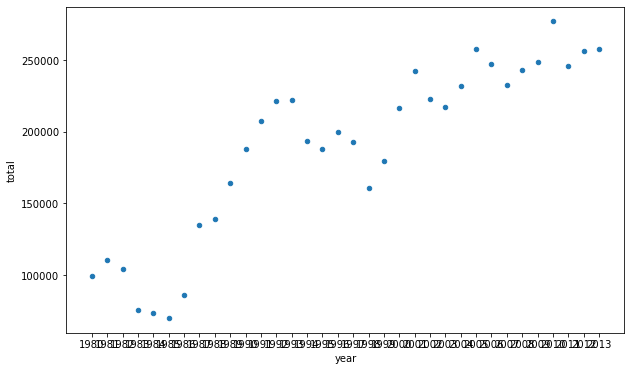
df_total.plot('year','total',kind='scatter',figsize=(10,6))

plt.title('Scatters Plot')
plt.xticks(rotation='vertical')
([0,
1,
2,
3,
4,
5,
6,
7,
8,
9,
10,
11,
12,
13,
14,
15,
16,
17,
18,
19,
20,
21,
22,
23,
24,
25,
26,
27,
28,
29,
30,
31,
32,
33],
<a list of 34 Text major ticklabel objects>)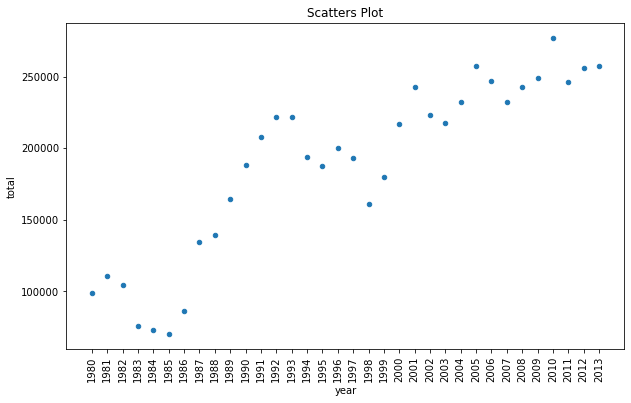
PIE CHARTS
df_continents=df.groupby('Continent',axis=0).sum()
df_continents| 1980 | 1981 | 1982 | 1983 | 1984 | 1985 | 1986 | 1987 | 1988 | 1989 | ... | 2005 | 2006 | 2007 | 2008 | 2009 | 2010 | 2011 | 2012 | 2013 | Total | |
|---|---|---|---|---|---|---|---|---|---|---|---|---|---|---|---|---|---|---|---|---|---|
| Continent | |||||||||||||||||||||
| Africa | 3951 | 4363 | 3819 | 2671 | 2639 | 2650 | 3782 | 7494 | 7552 | 9894 | ... | 27523 | 29188 | 28284 | 29890 | 34534 | 40892 | 35441 | 38083 | 38543 | 618948 |
| Asia | 31025 | 34314 | 30214 | 24696 | 27274 | 23850 | 28739 | 43203 | 47454 | 60256 | ... | 159253 | 149054 | 133459 | 139894 | 141434 | 163845 | 146894 | 152218 | 155075 | 3317794 |
| Europe | 39760 | 44802 | 42720 | 24638 | 22287 | 20844 | 24370 | 46698 | 54726 | 60893 | ... | 35955 | 33053 | 33495 | 34692 | 35078 | 33425 | 26778 | 29177 | 28691 | 1410947 |
| Latin America and the Caribbean | 13081 | 15215 | 16769 | 15427 | 13678 | 15171 | 21179 | 28471 | 21924 | 25060 | ... | 24747 | 24676 | 26011 | 26547 | 26867 | 28818 | 27856 | 27173 | 24950 | 765148 |
| Northern America | 9378 | 10030 | 9074 | 7100 | 6661 | 6543 | 7074 | 7705 | 6469 | 6790 | ... | 8394 | 9613 | 9463 | 10190 | 8995 | 8142 | 7677 | 7892 | 8503 | 241142 |
| Oceania | 1942 | 1839 | 1675 | 1018 | 878 | 920 | 904 | 1200 | 1181 | 1539 | ... | 1585 | 1473 | 1693 | 1834 | 1860 | 1834 | 1548 | 1679 | 1775 | 55174 |
6 rows × 35 columns
df_continents['Total'].plot(kind='pie',figsize=(5,6),autopct='%1.1f%%') #yang persen gaje nambahin persen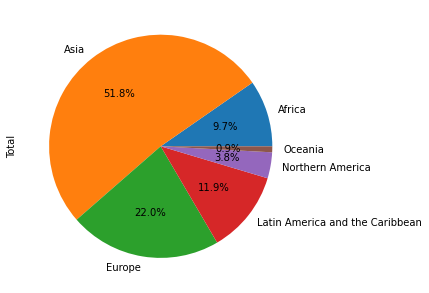
df_continents['Total'].plot(kind='pie',figsize=(5,6),autopct='%1.1f%%',startangle=90,shadow=True) #wow diputer 90 derajat plus ada bayangan

plt.axis('equal') #untuk bulat sempurna katanya sih gitu
plt.show()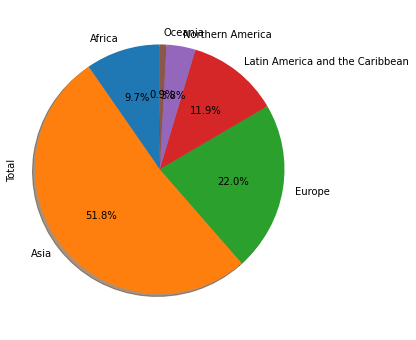
BAR CHART
algeria.head()1980 80
1981 67
1982 71
1983 69
1984 63
Name: Algeria, dtype: objectalgeria.plot(kind='bar',figsize=(10,6))
plt.xlabel('Year')
plt.ylabel('Banyak Warga')
plt.title('Bar Chart')Text(0.5, 1.0, 'Bar Chart')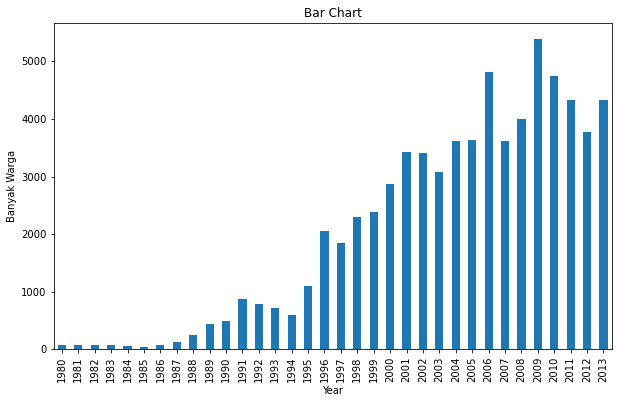
algeria.plot(kind='barh',figsize=(10,6))

plt.xlabel('Year')
plt.ylabel('Banyak Warga')
plt.title('Bar Chart')
Text(0.5, 1.0, 'Bar Chart')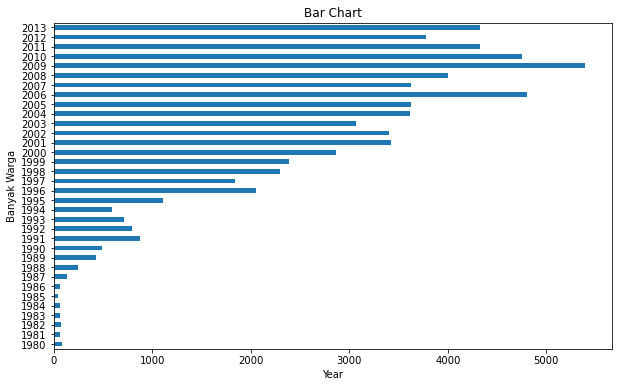
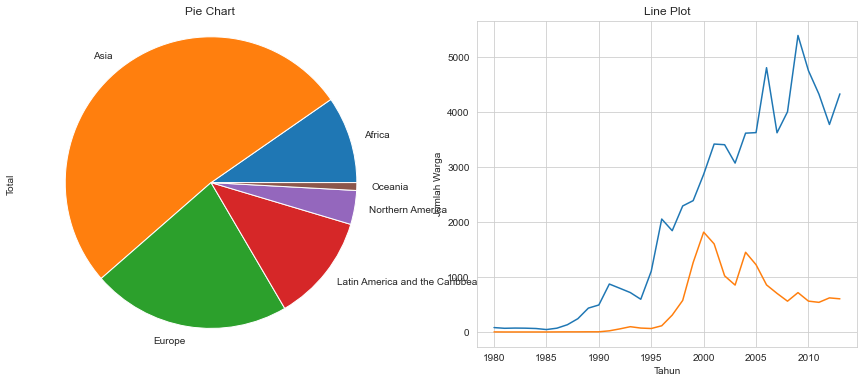
SUBPLOT
sns.set_style('whitegrid')

fig=plt.figure(figsize=(30,20))
ax0=fig.add_subplot(1,2,1)
ax1=fig.add_subplot(1,2,2)

#pie
df_continents['Total'].plot(kind='pie',ax=ax0) #Maksudnya plotnya ini ditaruh di kanvas ax0
ax0.set_title('Pie Chart')
ax0.axis('equal')

#line
algeria.plot(kind='line',figsize=(15,6),ax=ax1)
albania.plot(kind='line',figsize=(15,6),ax=ax1)
ax1.set_title('Line Plot')

ax1.set_ylabel('Jumlah Warga')
ax1.set_xlabel('Tahun')

plt.show()