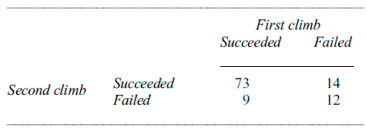
climb=matrix(c(73, 14, 9, 12), byrow=TRUE, nrow=2, ncol=2)
climbPertemuan 4: Uji McNemar, Cox Stuart, Wilcoxon
Statistika Nonparametrik
Offline di Departemen Matematika
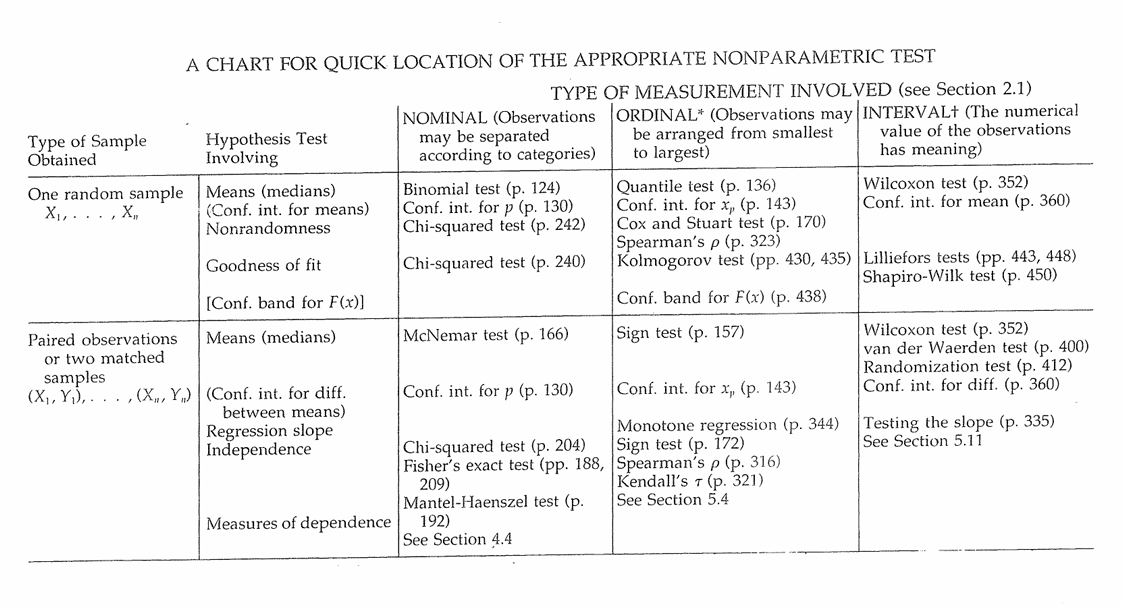
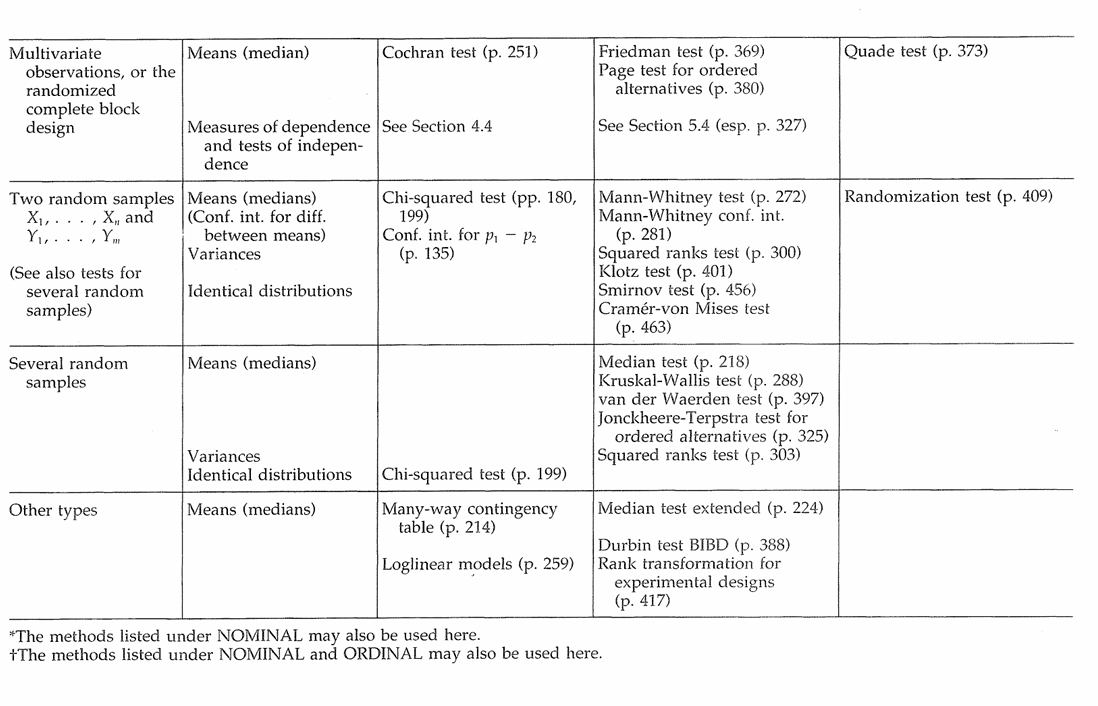
Tabel Guide Uji Nonparametrik
Uji McNemar
- Anggota klub pendakian gunung telah lama berdebat tentang mana yang lebih sulit di antara 2 jalur panjat tebing. Berharap untuk menyelesaikan argumen satu anggota memeriksa buku catatan klub. Catatan ini berisi apakah tiap anggota berhasil suatu pendakian. Log menunjukkan bahwa 108 anggota telah mencoba kedua pendakian dengan hasil yang dirangkum dalam Tabel. Apakah ada bukti bahwa satu pendakian lebih sulit dari lainnya?
Uji Hipotesis :
\(H_0: \text{Tidak terdapat perbedaan signifikan}\)
\(H_1: \text{Tidak demikian}\)
library(stats)

#H0: Tidak terdapat perbedaan signifikan
mcnemar.test(climb) #Package stats
Apa maksudnya Continuity Correction?
Telusuri sumber berikut: Continuity Correction on Wikipedia
Kenapa digunakan pada fungsi mcnemar.test()?
Telusuri sumber berikut: Continuity Correction for Pearson and McNemar’s Chi Square Test
mcnemar.test(climb, correct=FALSE)Lebih baik jika kita menggunakan mcnemar.exact() dari library exact2x2
library(exact2x2)

mcnemar.exact(climb) #Package exact2x2
TipDokumentasi Fungsi
mcnemar.test()
https://www.rdocumentation.org/packages/stats/versions/3.6.2/topics/mcnemar.test
atau run ?mcnemar.test setelah import library stats
Latihan Soal Uji McNemar
- One hundred thirty-five citizens were selected at random and were asked to state their opinion regarding U.S. foreign policy. Forty-three were opposed to the U.S. foreign policy. After several weeks, during which they received an informative newsletter, they were again asked their opinion; 37 were opposed, and 30 of the 37 were persons who originally were not opposed to the U.S. foreign policy. Is the change in numbers of people opposed to the U.S. foreign policy significant?
| Not Opposed | Opposed | |
|---|---|---|
| Not Opposed | 72 | 30 |
| Opposed | 36 | 7 |
Uji Cox Stuart
- Departemen Perdagangan AS menerbitkan perkiraan yang diperoleh dari sampel independen setiap tahun dari jarak tempuh tahunan rata-rata yang dicakup oleh berbagai kelas kendaraan di Amerika Serikat. Angka-angka untuk mobil dan truk (dalam ribuan mil) diberikan di bawah ini untuk setiap tahun 1970-1983. Apakah ada bukti tren monoton dalam kedua kasus?
| Cars | 9.8 | 9.9 | 10.0 | 9.8 | 9.2 | 9.4 | 9.5 | 9.6 | 9.8 | 9.3 | 8.9 | 8.7 | 9.2 | 9.3 |
|---|---|---|---|---|---|---|---|---|---|---|---|---|---|---|
| Trucks | 11.5 | 11.5 | 12.2 | 11.5 | 10.9 | 10.6 | 11.1 | 11.1 | 11.0 | 10.8 | 11.4 | 12.3 | 11.2 | 11.2 |
cars=c(9.8, 9.9, 10, 9.8, 9.2, 9.4, 9.5,
          9.6, 9.8, 9.3, 8.9, 8.7, 9.2, 9.3)

trucks=c(11.5, 11.5, 12.2, 11.5, 10.9, 10.6, 11.1,
            11.1, 11, 10.8, 11.4, 12.3, 11.2, 11.2)
Uji Hipotesis :
\(H_0: \text{Kasus Monoton}\)
\(H_1: \text{Tidak demikian}\)
library(randtests)

cox.stuart.test(cars, alternative="two.sided") #Package randtests

cox.stuart.test(trucks, alternative="two.sided")
Uji apakah cars memiliki trend naik/turun?
Uji Hipotesis :
\(H_0: \text{Kasus Monoton Tidak Naik}\)
\(H_1: \text{Terdapat Tren Naik}\)
cox.stuart.test(cars, alternative="right.sided") Uji Hipotesis :
\(H_0: \text{Kasus Monoton Tidak Turun}\)
\(H_1: \text{Terdapat Tren Turun}\)
cox.stuart.test(cars, alternative="left.sided") Latihan Soal Uji Cox Stuart
- For each of the last 34 years a small Midwestern college recorded the average heights of male freshmen. The averages were 68.3, 68.6, 68.4, 68.1, 68.4, 68.2, 68.7, 68.9, 69.0, 68.8, 69.0, 68.6, 69.2, 68.9, 68.6, 68.6, 68.8, 69.2, 68.8, 68.7, 69.5, 68.7, 68.8, 69.4, 69.3, 69.3, 69.5, 69.5, 69.0, 69.2, 69.2, 69.1, 69.9. Do these averages indicate an increasing trend in height?
Uji Wilcoxon
- Misalkan Set 1 adalah 𝑋, dan Set 2 adalah 𝑌.
| Set I | 1 | 1 | 1 | 1 | 1 | 3 | 3 | 5 | 5 | 7 | 7 |
|---|---|---|---|---|---|---|---|---|---|---|---|
| Set II | 1 | 2 | 2 | 4 | 4 | 4 | 4 | 5 | 5 | 5 | 7 |
Apakah di antara kelompok terdapat perbedaan yang signifikan?
x=c(1,1,1,1,1,3,3,5,5,7,7)
y=c(1,2,2,4,4,4,4,5,5,5,7)
Uji Hipotesis :
\(H_0: \text{Tidak terdapat perbedaan yang signfikan antara X dan Y (Ekspektasi X = Ekspektasi Y)}\)
\(H_1: \text{Tidak demikian}\)
Library stats memiliki function wilcox.test() yang dapat digunakan untuk melakukan uji Wilcoxon. Tetapi tidak bisa menghitung exact p-value pada data dengan ties.
wilcox.test(x, y, alternative='two.sided') #Package statsSebagai alternatif, gunakan fungsi wilcoxsign_test() dari library coin
library(coin)

wilcoxsign_test(y~x, distribution="exact", zero.method="Wilcoxon")
wilcoxsign_test(y~x, distribution="approximate", zero.method="Wilcoxon")
Latihan Soal Uji Wilcoxon
- A random sample consisting of 20 people who drove automobiles was selected to see if alcohol affected reaction time. Each driver’s reaction time was measured in a laboratory before and after drinking a specified amount of a beverage containing alcohol. The reaction times in seconds were as follows
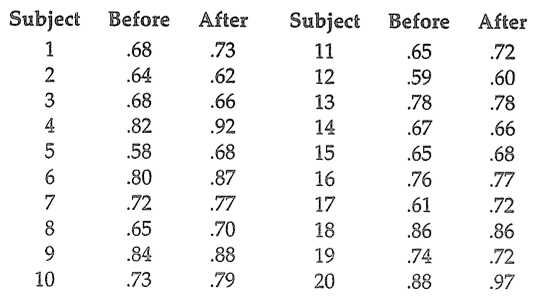
Does alcohol affect reaction time?